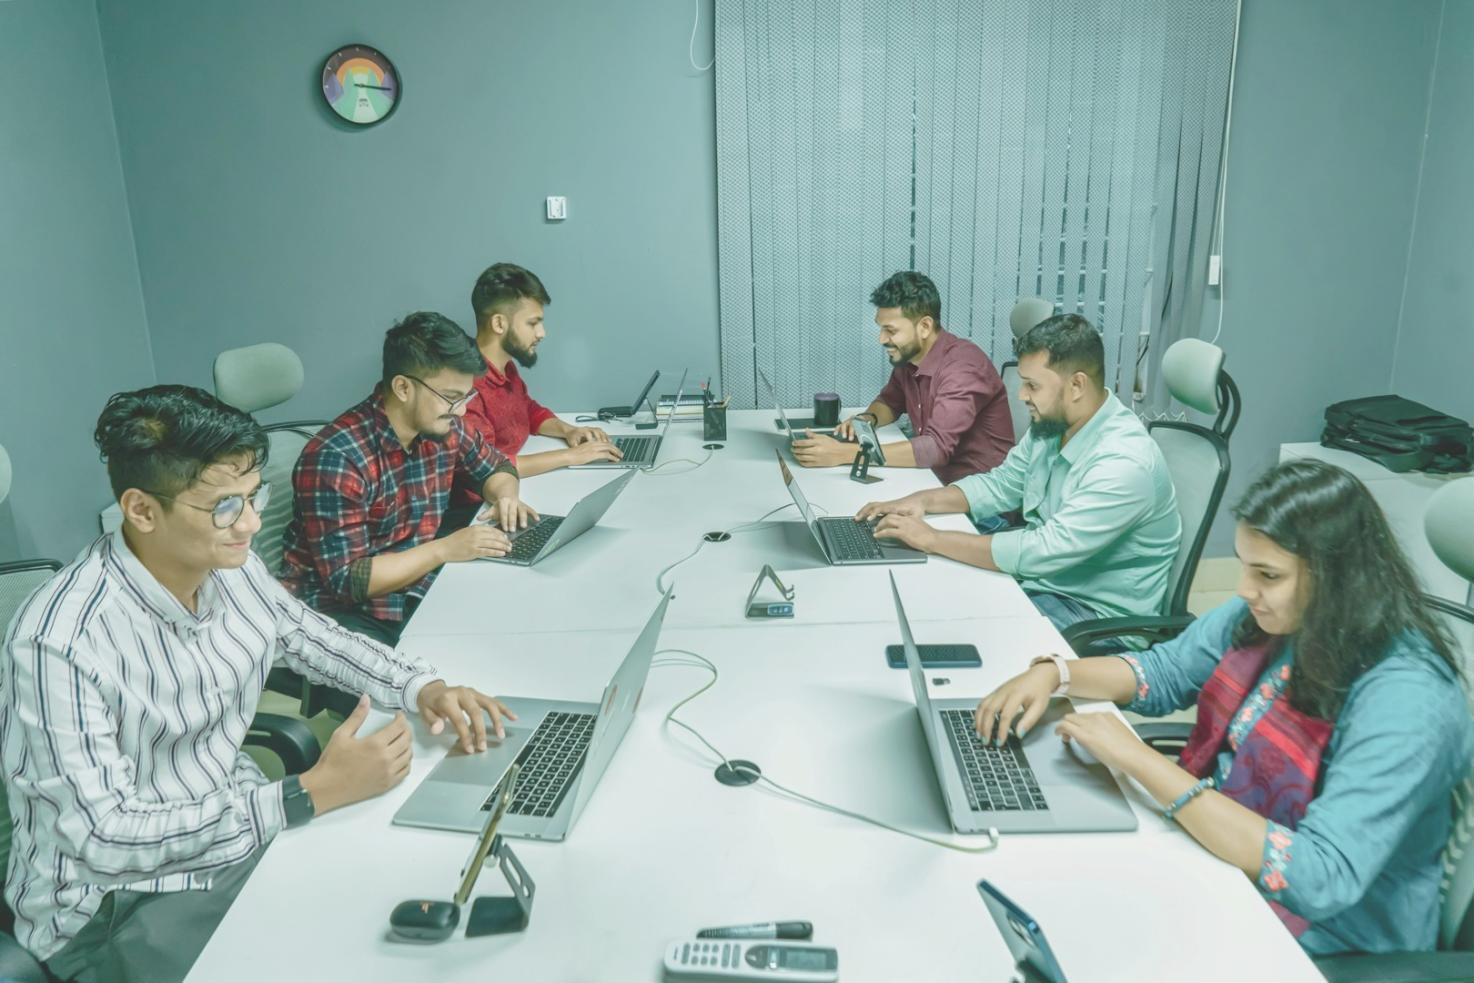
We solve the problems that keep your users from coming back
Performance bottlenecks kill user retention. We find them and fix them.
Since 2019, we've been working with mobile teams across Japan who know their apps could be faster but can't pinpoint exactly where the problems are. That's what we do.
Started from one frustrating question
Back in early 2019, a colleague asked me why his perfectly coded app felt sluggish on real devices. The simulator ran fine. Profiler showed nothing alarming. But actual users complained about lag.
Turned out the problem wasn't in his code at all. It was in how the bridge between native and JavaScript layers handled rapid state updates. Something you'd never catch in standard testing.
That's when I realized most mobile performance issues hide in the spaces between systems. Network calls that bundle poorly. State management that triggers unnecessary renders. Memory patterns that look fine until they compound.
So we built NodeBridgeFlow around finding those hidden bottlenecks. Not with generic advice, but through systematic analysis of how data actually moves through your app under real-world conditions.

What we've learned from 140+ optimization projects
These numbers reflect actual results from apps we've worked with between early 2020 and March 2025. Your results will vary based on your specific bottlenecks.
Measured across 67 production apps after implementing bridge optimization and selective lazy loading strategies
Frame rate improvements in list views with heavy data rendering after optimizing component update patterns
From fintech startups to enterprise retail apps serving millions of daily active users across Japan
The team behind the optimization work
We're not a large agency. Just two engineers who've spent years debugging why apps that should run smoothly don't.

Torvald Bjornsson
Lead Performance Engineer
Spent seven years at a Tokyo-based e-commerce company optimizing their mobile checkout flow. Found that most conversion drops came from perceived slowness rather than actual bugs. Now focuses exclusively on bridge performance and state management patterns.

Casimir Novak
Mobile Architecture Specialist
Background in native Android development before switching to cross-platform work in 2018. Specializes in memory profiling and identifying where JavaScript bridge calls create unexpected bottlenecks. Has debugged over 80 production apps.


How we actually work with your team
We profile first, recommend second
Connect monitoring to your staging environment. Watch how data moves through your app under realistic load. Identify specific bottlenecks before suggesting any changes. Usually takes 5-7 days to gather meaningful patterns.
Prioritize by impact, not complexity
Some fixes are simple but create huge improvements. Others require weeks of refactoring for minimal gain. We focus on changes that give you measurable performance wins within your development timeline and resource constraints.
Implement alongside your developers
We don't hand over a report and disappear. Work directly with your team to implement optimizations, test on actual devices, and make adjustments based on what we find. Most optimization projects run 6-10 weeks depending on app complexity.
Let's figure out what's slowing your app down
Most performance problems have specific causes. We can usually identify the main bottlenecks within a week of profiling.
Schedule a profiling session